Welcome to Taxo Tape
TIM Failure Diagnosis for Industrial Inverters: 4 Common Problems

Introduction
Thermal protection trips and elevated junction temperatures in industrial inverters are straightforward to detect and frustrating to diagnose. The symptoms — increasing trip frequency, higher steady-state junction temperatures, unit-to-unit performance variation — point clearly to a thermal management problem, but not necessarily to where in the thermal stack the problem originates.
TIM-related issues are among the most commonly misdiagnosed thermal problems in inverter assemblies, for two reasons. First, the TIM is invisible once the assembly is complete — there is no sensor at the interface, and thermal resistance cannot be measured without disassembly. Second, TIM degradation is gradual in most cases, which means the problem develops slowly enough that initial qualification testing shows nothing wrong. By the time the issue becomes operationally significant, the root cause is obscured by time and by the assumption that a product which passed qualification should continue to perform correctly.
This guide covers four common TIM problem scenarios in industrial inverters — each with a distinct symptom pattern, root cause, and resolution. It is structured as a diagnostic reference for engineers and maintenance engineers dealing with thermal performance issues in inverter assemblies, and as a design reference for engineers specifying TIMs for new inverter designs who want to avoid these failure modes from the outset.
For background on TIM selection criteria and material types for industrial inverter applications, see the companion guide on Thermal Interface Materials for Industrial Inverters: IGBT Cooling and Long-Term Reliability.
Problem 1: Gradual Junction Temperature Rise After 12–18 Months
Symptom description
The inverter operates normally at commissioning and through initial service. Thermal protection trips begin appearing 12 to 18 months into operation, initially infrequent and at near-full load, then progressively more frequent at lower load levels. Junction temperature measurements at the same load point show a steady upward trend compared to initial commissioning data — 5°C higher at 12 months, 10°C higher at 18 months, continuing to rise.
The unit has not been modified. Ambient temperature, load profile, and coolant conditions are unchanged. The heatsink is clean and coolant flow is confirmed normal.
Root cause: thermal grease pump-out
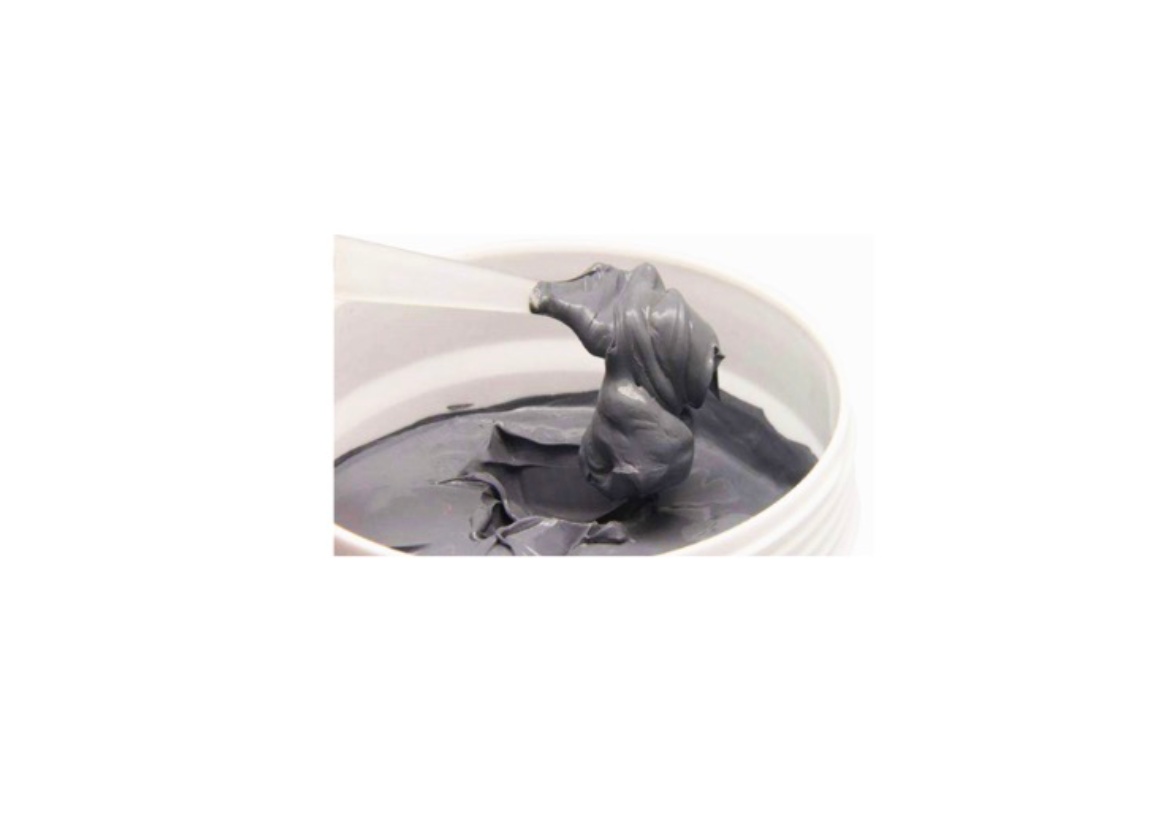
This symptom pattern is characteristic of thermal grease pump-out at the IGBT-to-heatsink interface. Pump-out is the gradual migration of grease away from the center of the interface toward the edges under the combined effect of sustained compressive load and thermal cycling. Each power-on and power-off cycle, and each load variation, slightly expands and contracts the IGBT module and heatsink at different rates — their coefficients of thermal expansion differ — which creates a small but repeated shear force at the grease layer. Over hundreds of cycles, this force progressively displaces the grease outward.
The result is a thinning grease layer at the center of the interface — directly beneath the highest power-density region of the IGBT die — and an accumulation of excess grease at the perimeter. The interface resistance increases as the effective grease layer becomes thinner and less uniform. Because the process is gradual and the grease is not visible without disassembly, the increasing junction temperature is often attributed to component aging rather than interface degradation.
How to confirm the diagnosis
Disassemble one representative unit from the affected population and inspect the IGBT-to-heatsink interface. Pump-out presents as a characteristic pattern: grease bead accumulated around the perimeter of the module footprint, with a visibly thinner or dry-looking area at the center. In severe cases, direct metal-to-metal contact is visible at the center of the interface where the grease has completely displaced.
If the pattern matches — perimeter accumulation with thin or absent coverage at center — pump-out is confirmed as the root cause. If the grease appears uniformly distributed, investigate other thermal stack elements before concluding TIM is the problem.
The fix
Replace the thermal grease specification with a BN-filled silicone pad of appropriate conductivity for the power level — typically 6.0 – 8.0 W/m·K for IGBT modules in industrial inverters. Pads do not pump out. They maintain their dimensional stability and interface position throughout the product service life regardless of the thermal cycling profile.
For the affected units already in service, the repair requires disassembly, complete removal of the existing grease using IPA-soaked lint-free wipes, surface cleaning and inspection, and installation of the new pad format. Re-torque fasteners to specification using a calibrated torque tool.
Production and documentation changes
Update the Bill of Materials and assembly work instruction to specify the pad format, conductivity tier, and nominal thickness. Remove the grease dispensing step and the associated dispensing volume specification. Update the incoming inspection criteria to cover pad thickness and hardness. If the inverter design is still in active production, implement the change before the next production run rather than waiting for field returns to accumulate.
Problem 2: Unit-to-Unit Junction Temperature Variation in Production
Symptom description
End-of-line thermal testing on a production batch reveals significant spread in junction temperature across units built to the same specification. At identical load and ambient conditions, junction temperature varies by 8 to 15°C across the production population. Some units pass thermal acceptance criteria comfortably; others are borderline or failing. The units are otherwise electrically identical and use the same components from the same production lot.
Root cause: inconsistent grease application and BLT variation
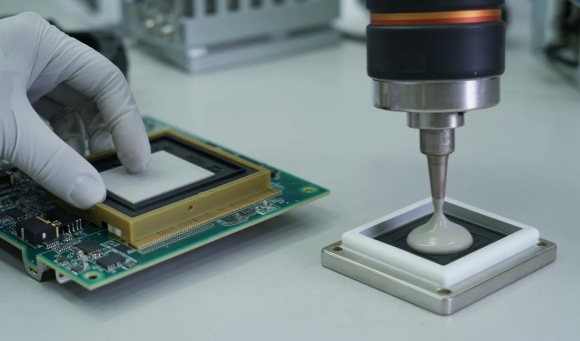
In assemblies using manually applied thermal grease, the quantity of grease applied varies from operator to operator and shift to shift. The variation is not the result of carelessness — it reflects the inherent difficulty of applying a consistent bead of viscous material by hand without precise volume control.
More grease produces a thicker bond line. A thicker bond line produces higher thermal resistance. The relationship is direct: for a material at 5.0 W/m·K, the difference between a 0.1mm and a 0.3mm bond line is approximately 0.04 °C·cm²/W of thermal resistance — which across a 30cm² IGBT module footprint at 100W dissipation produces approximately 1.3°C of junction temperature difference per 0.1mm of BLT variation. A 0.2mm total BLT spread across the production population produces a 2.6°C junction temperature spread from this source alone.
When multiple operators apply grease with different natural tendencies — some applying more, some less — the BLT distribution across a production batch is wide enough to explain the 8 to 15°C junction temperature spread observed.
How to confirm
Measure BLT on a sample of production units that have been assembled but not yet powered. BLT can be estimated from the known component height, heatsink surface position, and fastener torque by dimensional measurement, or more directly by measuring the gap before pad installation and after assembly on disassembled samples. For grease applications, the correlation between grease quantity (measured by weighing the syringe before and after application) and resulting BLT across a sample of units confirms whether application variation is the source.
If measured BLT variation across the production sample matches the pattern of junction temperature variation — units with more grease running hotter — grease application inconsistency is confirmed as the root cause.
The fix — option 1: move to pad format
The most reliable fix is to eliminate the manual grease application step and replace it with a thermal pad. Pad thickness variation is controlled by the manufacturer to ±10% or tighter, which produces a much narrower BLT distribution across the production population than manual grease application. The junction temperature spread narrows correspondingly.
This fix requires the same TIM format change described in Problem 1 and produces the additional benefit of eliminating pump-out risk simultaneously.
The fix — option 2: implement dispensing process controls
If grease must be retained for technical reasons — for example, the assembly design does not accommodate pad thickness — implement automated or semi-automated dispensing with calibrated volume output. A dispensing system with ±5% volume repeatability produces far more consistent BLT than manual application. Pair with in-process weight verification of the dispensed quantity before assembly completion.
This option adds equipment cost and process complexity. For high-volume production where the grease format is strongly preferred, it may be cost-effective. For most industrial inverter production volumes, switching to pad format is simpler and more reliable.
Incoming inspection criteria
After implementing either fix, establish incoming inspection criteria for the TIM parameter most directly linked to BLT: pad thickness at five measurement points per sample for pad format, or dispensing volume verification for grease. Document the acceptance range derived from the production qualification data — not from the supplier datasheet — and verify each incoming batch against it.
Problem 3: Thermal Performance Degradation After Heatsink Change
Symptom description
Thermal performance is acceptable through design qualification and initial production. A heatsink supplier change or design revision is implemented — apparently a straightforward substitution — and junction temperature increases by 5 to 12°C at the same load and ambient conditions. The TIM specification has not changed. The new heatsink meets the same thermal resistance specification as the original.
This problem is commonly misattributed to the TIM or to the heatsink thermal resistance. The actual cause is usually neither.
Root cause: surface finish change at the TIM interface
Heatsink thermal resistance specifications — expressed as °C/W or °C·cm²/W — characterize heat transfer from heatsink surface to ambient. They do not characterize the contact interface between the TIM and the heatsink surface, which depends on surface roughness rather than heatsink thermal resistance.
When a heatsink supplier changes, the manufacturing process often changes with it — different machining parameters, different surface treatment, or a shift from machined to extruded or die-cast construction. Surface roughness Ra can shift from 0.4 µm on a finish-machined surface to 2.0 µm or higher on an as-extruded or as-cast surface, without any change in the heatsink thermal resistance specification.
A thermal pad that made intimate contact with a smooth machined surface at moderate hardness may bridge surface peaks on a rougher surface without filling the valleys, creating air pockets at the interface that add contact resistance. The thermal resistance increase is entirely at the contact interface — not in the bulk pad material and not in the heatsink bulk — but it shows up as elevated junction temperature and is easily misattributed to either the TIM or the heatsink.
How to confirm
Measure surface roughness (Ra) on both the original and new heatsink at the IGBT mounting location. If Ra has increased by more than 0.5 µm, surface finish change is a plausible contributing factor. Confirm by measuring thermal resistance in a controlled assembly using the original heatsink and the new heatsink with identical TIM material and clamping conditions — the difference isolates the contact interface contribution.
A thermal camera image of the heatsink surface under steady-state powered operation can also reveal non-uniform contact: hot spots on the heatsink surface directly beneath specific regions of the IGBT footprint indicate poor TIM contact at those locations, consistent with surface roughness causing incomplete contact.
The fix
Two approaches, depending on the situation:
If the heatsink surface finish can be controlled: add a surface roughness specification — Ra ≤ 0.8 µm or tighter — to the heatsink drawing and purchasing specification. Verify compliance on incoming inspection. This is the preferred fix if the heatsink supplier can hold the specification consistently.
If the heatsink surface finish cannot be economically controlled: change the TIM specification to a softer pad that accommodates higher surface roughness through greater elastic compliance. A softer pad — Shore 00 20–40 rather than 40–60 — deforms more readily under assembly pressure and fills surface irregularities more completely, recovering most of the contact resistance that the rougher surface introduced. The conductivity of the softer pad may be slightly lower than the original, but the net thermal resistance at the interface is often better due to the improved contact area.
Why this is misattributed to the TIM
The timing of the change — heatsink supplier or design change immediately followed by thermal performance degradation — points clearly to the heatsink as the source. But because the heatsink thermal resistance specification has not changed and the heatsink passes its own specification, the blame often shifts to the TIM. The TIM has not changed either, but it is invisible and unmeasured, making it a convenient candidate for root cause assignment.
The correct diagnostic sequence is to measure the contact interface resistance directly — by comparing thermal resistance before and after the heatsink change with controlled variables — rather than inferring the root cause from the timing of events.
Problem 4: TIM Cracking or Delamination in High-Vibration Applications
Symptom description
Thermal performance is normal at installation and through initial service. The inverter is installed in a high-vibration environment — mounted on industrial machinery, a compressor skid, or a vehicle-mounted power system. After six to twelve months of operation, junction temperature begins rising. Thermal protection trips increase. Unlike the gradual rise associated with grease pump-out, the degradation may be more erratic — performance varies with operating conditions in a way that suggests intermittent rather than continuous interface degradation.
In some cases, audible or tactile changes in the assembly — slight movement at the IGBT module mounting — accompany the thermal symptoms.
Root cause: pad cracking or delamination under vibration stress
Hard or high-filler-loading thermal pads — particularly some BN-filled formulations at Shore 00 60 or higher — can develop fatigue cracks or delaminate from one or both mating surfaces under sustained vibration. The mechanism is cyclic shear stress at the pad-to-metal interface, driven by differential vibration response between the IGBT module and the heatsink. If the pad material cannot accommodate this shear through elastic deformation, stress concentrates at the interface boundary and progressive delamination develops.
Delamination creates air pockets at the interface — the same thermal resistance mechanism as poor surface contact, but developing progressively rather than being present from initial assembly. Cracking within the bulk pad material produces similar effects: the crack surfaces are separated by air, which adds thermal resistance proportional to the crack width and area.
This failure mode is distinct from pump-out and from contact resistance problems. It is specifically associated with vibration exposure and hard or poorly adhering TIM materials, and it does not occur in benign laboratory or office environments where most qualification testing takes place.
How to confirm
Disassemble a representative unit from the affected population and inspect both the pad and the mating surfaces. Delamination presents as clean separation of the pad from one surface, often with a visible boundary between adhered and non-adhered regions. Cracking presents as visible fracture lines within the pad material, sometimes accompanied by fine filler particle debris at the crack surfaces.
If the pad appears intact and fully adhered, vibration-induced TIM damage is less likely and the investigation should shift to other sources. If delamination or cracking is confirmed, document the location and extent — whether it is concentrated at the perimeter, the center, or along specific edge directions — as this helps identify whether the stress source is vibration amplitude, vibration direction, or fastener arrangement.
The fix
Specify a softer, more compliant pad formulation — Shore 00 30–45 — that can accommodate vibration-induced shear through elastic deformation rather than transmitting it to the interface boundary. Softer pads have lower elastic modulus and higher elongation before failure, which makes them significantly more resistant to vibration fatigue than harder formulations at equivalent conductivity.
If the original specification used a pad with adhesive backing on one face, evaluate whether the adhesive bond strength is contributing to delamination by creating a rigid connection on one side while the other side moves with vibration. In some vibration applications, non-adhesive pads held in place by assembly clamping pressure alone show better long-term adhesion than pads with pressure-sensitive adhesive, because the adhesive bond does not generate peel stress under vibration.
Also review the fastener arrangement and clamping torque. A module that is not evenly clamped — one fastener looser than the others, or a clamping arrangement that does not distribute pressure uniformly across the module footprint — concentrates vibration stress at the under-clamped edge, which is where delamination typically initiates. Re-torque all fasteners to specification using a calibrated torque tool and verify that the torque sequence produces even clamping.
Applications where this is most common
Motor drive inverters mounted directly on machinery frames — particularly compressors, pumps, and machine tools with significant vibration output. Vehicle-mounted power electronics where road vibration transmits through the chassis to the inverter mounting. Any application where the inverter enclosure is not vibration-isolated from a significant vibration source and where the TIM specification was developed in a benign laboratory environment without vibration testing.
How to Diagnose a TIM Problem vs. Other Thermal Issues
The diagnostic hierarchy
Before concluding that a thermal performance problem in an industrial inverter is TIM-related, rule out the more common and more easily checked causes in this order.
Heatsink fouling: in air-cooled inverters, fin fouling from dust, oil mist, or process contamination is the most common cause of thermal performance degradation over time. Inspect and clean the heatsink before any further investigation. In liquid-cooled inverters, check coolant flow rate and inlet temperature — a partially blocked coolant circuit or reduced pump performance produces the same symptom as TIM degradation and is far more common.
Ambient temperature change: seasonal ambient temperature variation in facilities without climate control can account for 5 to 10°C of junction temperature change independently of any inverter or TIM change. Confirm that the junction temperature comparison is made at equivalent ambient conditions.
Load profile change: increased load on the driven system — a pump operating against higher head, a motor driving a more demanding process — increases device power dissipation and junction temperature. Confirm that the load profile at the time of elevated junction temperature measurement matches the reference condition.
Only after these are confirmed equivalent or ruled out should the investigation focus on the TIM interface.
Tests that confirm TIM is the root cause
The definitive test for TIM degradation is thermal resistance measurement before and after disassembly with fresh TIM installation. If junction temperature at a defined load returns to the original value after TIM replacement — with the heatsink, coolant conditions, and load held constant — the TIM was the degraded element. If junction temperature remains elevated after TIM replacement, the problem is elsewhere in the thermal stack.
This test requires a controlled disassembly, TIM replacement, and reassembly under production-representative conditions — not field conditions where torque control and surface cleanliness may be compromised. Conduct it in a controlled workshop environment with calibrated tools and documented procedure.
What to look for during disassembly
Remove the IGBT module carefully, keeping the mating surfaces horizontal to avoid disturbing any displaced grease before documenting the interface condition. Photograph the interface immediately after separation — the grease or pad condition degrades rapidly once exposed to air and handling.
For grease interfaces: document the distribution pattern. Uniform coverage with slight perimeter extrusion indicates normal compression and no pump-out. Perimeter accumulation with thin or absent center coverage confirms pump-out. Localized dry areas in specific regions may indicate surface flatness problems rather than pump-out.
For pad interfaces: document adhesion on both faces, any visible cracking or tearing, and whether the compression marks — the imprint of the module baseplate surface features on the pad — are uniform across the full footprint. Non-uniform compression marks indicate uneven clamping or surface flatness variation.
When to involve the TIM supplier
If the failure mode does not match any of the patterns described above — if the interface looks normal on disassembly inspection but thermal resistance is confirmed elevated — the investigation should involve the TIM supplier. Provide them with samples from affected units, the assembly conditions, the service history, and the thermal measurement data. A supplier with adequate technical support capability will conduct material analysis on the returned samples and identify whether the failure is material-related or assembly-related. A supplier who cannot support this level of root cause analysis is telling you something about their technical capability that is relevant to the ongoing supply relationship.
Process Changes That Prevent Recurring TIM Problems
Switching from grease to pad
The process change that prevents Problems 1 and 2 — pump-out and application variation — is replacing grease with pad format. The production process change is straightforward: remove the grease dispensing step, add a pad placement step. The pad placement step requires no dispensing equipment, no volume calibration, and no operator training for grease application technique.
The documentation change requires updating the assembly work instruction with pad dimensions, part number, liner removal sequence, and positioning reference. Update the BOM with the pad part number and the fastener torque specification — verify that the torque value is appropriate for the pad's compression behavior at the target BLT, not carried over from the grease assembly.
Communicate the change to incoming inspection: add pad thickness and hardness to the incoming inspection checklist, with acceptance criteria derived from qualification data rather than from the supplier datasheet alone.
Implementing torque-controlled fastening
Unit-to-unit BLT variation — whether from grease application inconsistency or pad thickness tolerance — is compounded by fastener torque variation when hand-tightening is used. Implementing torque-controlled electric or pneumatic screwdrivers with calibrated clutch settings is the single process change that most consistently reduces junction temperature spread across a production population.
Define the torque specification for IGBT module fasteners based on the pad compression curve — the torque that produces the target BLT under the specific fastener geometry. Document this value in the assembly work instruction and verify it on a calibrated torque tool calibration schedule. Include the torque sequence — diagonal pairs, progressively increasing torque — as a defined step rather than leaving it to operator judgment.
Establishing incoming inspection criteria for TIM batches
Batch-to-batch TIM variation is a production quality risk that does not appear in qualification testing on a single batch. Establish incoming inspection criteria based on the critical parameters: pad thickness at five points across a sample of pads per delivery, hardness on a sample using a Shore 00 durometer, and thermal resistance spot-check on a production-representative test fixture for high-volume or critical applications.
Define the acceptance limits from qualification batch data — not from the supplier datasheet. The qualification data across multiple batches establishes the real production variation range; the datasheet reports a typical value that may not reflect that range accurately.
Adding TIM-related checks to maintenance procedures
For serviceable inverter designs — those that can be opened for periodic maintenance — add TIM inspection to the maintenance procedure. At the defined maintenance interval, remove the IGBT module cover and inspect the grease or pad interface visually. For grease designs: check for pump-out pattern. For pad designs: check for delamination or compression mark uniformity. Document the inspection result and replace the TIM if any degradation pattern is observed.
For sealed inverters where TIM inspection is not practical without full disassembly, the fix is specification change to eliminate degradation-prone materials — pad replacing grease — rather than inspection-based maintenance.
Conclusion
The four TIM problems described in this guide — grease pump-out, application variation, surface finish mismatch, and vibration-induced delamination — account for a substantial proportion of thermal performance issues in industrial inverter assemblies. Each has a recognizable symptom pattern, a diagnosable root cause, and a straightforward resolution that does not require exotic materials or major design changes.
The common thread across all four is that the problem is not visible from the outside. Junction temperature measurements and thermal protection trip logs tell you something is wrong; they do not tell you where. Disassembly inspection of the IGBT-to-heatsink interface — conducted with the discipline to document what you find before disturbing the interface — is the diagnostic step that makes root cause identification possible.
Most of these problems are also preventable by specification and process decisions made before production begins. Pad format over grease eliminates pump-out and application variation. Torque-controlled fastening reduces BLT spread. Surface finish specification on heatsink drawings prevents contact resistance degradation after supplier changes. Softer pad specifications in vibration-exposed applications prevent fatigue delamination. Each of these decisions costs less at the specification stage than the field return and rework cost it prevents.
For TIM selection guidance for industrial inverter applications — conductivity tiers, operating temperature requirements, and material type comparison — see the companion guide on Thermal Interface Materials for Industrial Inverters.
If you are investigating a thermal performance problem in an inverter assembly and need technical support for root cause analysis, or if you need samples for a specification change evaluation, contact us with your assembly details and we will respond within one business day.