Welcome to Taxo Tape
Why Same W/m·K Ratings Perform Differently in TIMs
Introduction
Here is a situation that comes up regularly in power electronics procurement: two thermal pads from different suppliers both list 6.0 W/m·K on their datasheets. Same nominal conductivity, similar price. You test them in your assembly and get different junction temperatures. One performs as expected. The other runs noticeably hotter.
This is not a quality control failure. It is a datasheet comparison problem — and it happens because W/m·K values are generated under different test conditions by different methods, and the number alone does not tell you how a material will behave in your actual assembly.
This article explains what thermal conductivity values on TIM datasheets actually represent, how measurement method affects the numbers, and how to build a comparison process that produces reliable results across suppliers. It is written for engineers and procurement managers who need to evaluate and select thermal interface materials for industrial power electronics applications.
What Thermal Conductivity Actually Measures
Thermal conductivity is a material property that describes how readily heat passes through a substance. The unit — W/m·K — breaks down as watts of heat flow per meter of material thickness per degree Kelvin of temperature difference. A higher value means heat moves through the material more easily.
For a thermal pad sitting between a power component and a heatsink, this matters because the pad is a resistance in the thermal path. Lower resistance means lower junction temperature for the same power dissipation, which directly affects component reliability and service life.
Bulk conductivity vs. interface performance
This is where the first practical complication appears. Thermal conductivity as reported on a datasheet is typically a bulk material property — measured through the body of the material under controlled laboratory conditions. What actually determines junction temperature in your assembly is the total thermal resistance at the interface, which includes the bulk conductivity of the pad but also the contact resistance at both mating surfaces.
Contact resistance arises because no two surfaces make perfect contact at a microscopic level. Surface roughness, flatness variation, and the pad's ability to conform to these irregularities all contribute to the real interface resistance. A pad with moderately high bulk conductivity but excellent surface conformability can outperform a stiffer pad with higher bulk conductivity that makes poor contact with a rough heatsink surface.
The W/m·K value describes one part of the picture. It does not describe the complete interface.
How W/m·K Is Measured — and Why the Method Changes Everything
This is the part that causes the most confusion in cross-supplier comparison, and it is rarely explained clearly on datasheets.
ASTM D5470
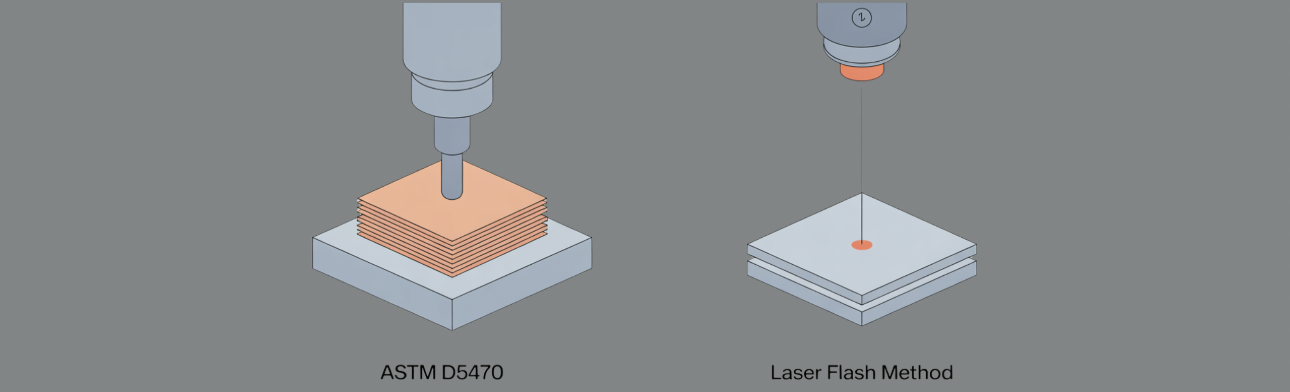
This is the most widely used standard for characterizing thermal interface materials in electronics applications. It works by measuring thermal impedance across a pad sample sandwiched between two metal blocks under a defined compressive load. Conductivity is calculated from the measured impedance, sample thickness, and contact area.
Because ASTM D5470 measures through an actual interface under pressure, it reflects real assembly conditions more closely than other methods. The result accounts for contact resistance at the surfaces, not just bulk material conductivity. This is why ASTM D5470 values tend to be lower than values from other methods for the same material — they are measuring something closer to what you will actually see in hardware.
Laser flash diffusivity (ISO 22007-4)
Laser flash measures how quickly a heat pulse travels through a free-standing material sample with no interface contact involved. It produces a diffusivity value that is then converted to conductivity using density and specific heat. Because there is no interface in the measurement, contact resistance is not captured — the result reflects the bulk material property only.
Laser flash values for the same material are consistently higher than ASTM D5470 values. The difference is not small. A material measuring 8.0 W/m·K via laser flash might measure 5.0 – 6.0 W/m·K via ASTM D5470. Both numbers are technically accurate for what they measure. They are measuring different things.
The practical implication
A pad reported at 8.0 W/m·K via laser flash and another reported at 6.0 W/m·K via ASTM D5470 are not directly comparable from the datasheet. The second pad may actually deliver lower thermal resistance in your assembly. Without knowing the test method, the comparison is meaningless.
When a supplier datasheet does not state the test method, ask directly before using the conductivity value for any engineering calculation or supplier comparison. If the supplier cannot tell you which standard was used, treat the number as unverified.
Test pressure matters too
Even within ASTM D5470, the reported conductivity value depends on the compressive pressure applied during measurement. Thermal pads compress under load, and conductivity improves as pressure increases because contact improves. A value measured at 10 psi and a value measured at 50 psi for the same pad will differ — sometimes significantly.
When comparing two suppliers using ASTM D5470 data, confirm that the test pressure is comparable. This information is sometimes buried in the test notes or available on request. Without it, you are still comparing numbers that were not generated under the same conditions.
Thermal Resistance vs. Thermal Conductivity — The Number That Actually Matters
Once you understand the limitations of W/m·K as a standalone comparison metric, the more useful number to work with is thermal resistance — expressed as °C·cm²/W or K·cm²/W depending on the datasheet convention.
Why thermal resistance is more useful
Thermal conductivity tells you a material property. Thermal resistance tells you the actual performance of a specific pad at a specific thickness under specific conditions. For procurement decisions, you are not buying a material property — you are buying a pad of defined thickness that will perform in a defined assembly. Thermal resistance connects the datasheet to that reality more directly.
The relationship between the two
Thermal resistance scales with thickness and inversely with conductivity:
R = t / λ R = thermal resistance (°C·cm²/W) t = bond line thickness in centimeters λ = thermal conductivity (W/m·K, converted to consistent units)
This relationship has a direct practical consequence: a thinner pad with lower conductivity can deliver lower thermal resistance than a thicker pad with higher conductivity. Consider a straightforward example:
| Pad | Conductivity | Thickness | Thermal Resistance |
|---|---|---|---|
| Pad A | 6.0 W/m·K | 1.5mm | 0.25 °C·cm²/W |
| Pad B | 8.0 W/m·K | 2.0mm | 0.25 °C·cm²/W |
| Pad C | 4.0 W/m·K | 1.0mm | 0.25 °C·cm²/W |
All three deliver the same thermal resistance despite different conductivity values. Pad B has the highest conductivity but also the highest thickness — the two effects cancel out. If your assembly gap requires 1.0mm, Pad C at 4.0 W/m·K is the correct choice and Pad B's higher conductivity is irrelevant.
How to use this in supplier comparison
When evaluating pads from multiple suppliers, convert to thermal resistance at your working bond line thickness before comparing. Many datasheets include a thermal impedance curve across a range of thicknesses — use this directly if available. If only the bulk conductivity is provided, calculate resistance at your expected BLT and compare on that basis.
This also highlights why specifying pad thickness matters as much as specifying conductivity. Leaving thickness open while comparing conductivity values across suppliers is an incomplete specification that leads to inconsistent results in production.
What Else Affects Real-World Interface Performance
W/m·K and thermal resistance get most of the attention in datasheet comparisons, but several other factors determine what actually happens at the interface in a production assembly. Ignoring them is one of the more common reasons a material that looks good on paper disappoints in hardware.
Contact resistance at mating surfaces
Even with a soft, conformable pad in place, neither the component package nor the heatsink surface is perfectly flat at a microscopic level. Surface peaks on both sides make contact with the pad while valleys trap small air pockets. Air has extremely low thermal conductivity — around 0.026 W/m·K — so even small trapped air regions contribute disproportionately to total interface resistance.
A pad's ability to flow into these surface irregularities under assembly pressure directly determines how much of the interface area makes real thermal contact. This conformability is driven by hardness and surface texture, neither of which appears in the W/m·K value.
Assembly pressure
Thermal resistance at the interface decreases as clamping pressure increases, up to a point. Higher pressure compresses the pad further, reduces bond line thickness, and improves surface contact. This is why ASTM D5470 test pressure matters when comparing datasheet values — and why real assembly clamping conditions need to match the conditions under which the datasheet was generated, or the numbers will not translate.
In practice, fastener torque variation across a production line introduces real pressure variation from unit to unit. A thermal model built around a single pressure value may not reflect the range of performance actually leaving the factory.
Surface finish on both mating surfaces
Heatsink surface roughness is rarely specified tightly in industrial assemblies. Machined heatsinks have Ra values typically in the range of 0.4 – 1.6 µm. Die-cast or extruded surfaces run considerably rougher. The rougher the surface, the more the pad needs to deform to fill the gaps — which favors softer, more conformable pads regardless of their bulk conductivity.
Component package surfaces vary too. Ceramic packages are generally flatter and smoother than plastic-encapsulated devices, which affects how much conformability the pad needs to provide at that interface.
Bond line thickness variation in production
Your thermal model uses a single BLT value. Your production line produces a distribution. Component height tolerance, PCB warpage, heatsink flatness, and fastener torque all contribute to unit-to-unit BLT variation. A pad specified to work at exactly 1.0mm BLT may run at 0.8mm in some units and 1.3mm in others — producing a corresponding spread in thermal resistance across the production population.
Designing with some thickness margin and validating across the expected BLT range — not just at the nominal value — gives a more accurate picture of production performance.
How to Compare TIM Suppliers Using Conductivity Data
Cross-supplier comparison done correctly is a five-step process. Skipping any step introduces uncertainty that shows up later in qualification testing or, worse, in field returns.
Step 1: Confirm the test method
Only compare ASTM D5470 values against other ASTM D5470 values. If one supplier uses laser flash and another uses ASTM D5470, the numbers are not on the same scale and direct comparison will mislead you. Ask every supplier for the specific standard used before putting their numbers in the same spreadsheet.
Step 2: Check the test pressure
Within ASTM D5470, confirm the compressive pressure at which the value was measured. Common values are 10 psi, 30 psi, and 50 psi — and the reported conductivity will differ across these. If possible, request data at the pressure closest to your actual assembly clamping condition.
Step 3: Compare thermal resistance at working thickness
Convert all candidates to thermal resistance at your expected bond line thickness, as described in section 4. This puts pads of different thicknesses on a common performance basis. If a supplier provides an impedance vs. thickness curve, use it directly — it is more informative than a single conductivity value.
Step 4: Request batch test data
A datasheet value is a single measurement from a characterized sample. It does not tell you what batch-to-batch variation looks like in production material. Request actual batch test reports from recent production lots. Suppliers with robust process control will have this data readily available. Those who do not may deliver material that varies more than the datasheet implies.
Step 5: Validate with samples in your actual assembly
No datasheet comparison replaces physical testing. Request samples from shortlisted suppliers and measure thermal resistance in your actual hardware under your actual assembly conditions. This is the only step that accounts for all the variables — surface finish, clamping pressure, BLT variation — simultaneously. Treat datasheet comparison as a filter to narrow the field, and sample testing as the final decision point.
Red flags worth knowing
A datasheet that lists no test method for conductivity. Conductivity values that seem unusually high for the filler type (alumina-filled pads above 5.0 W/m·K should be questioned). No compression curve provided. A supplier who cannot answer what pressure was used in their conductivity measurement. These are not automatic disqualifiers, but they warrant follow-up before approving a material.

Common Misreadings of Thermal Conductivity Data
Treating all pads at the same W/m·K as equivalent
Nominal conductivity groups pads by a single number but says nothing about filler type, test method, mechanical behavior, or long-term stability. Two pads at 5.0 W/m·K from different suppliers can produce measurably different junction temperatures in identical assemblies. The number is a starting point for comparison, not a performance guarantee.
Ignoring thickness when comparing conductivity
A 6.0 W/m·K pad at 2.0mm thickness delivers higher thermal resistance than a 4.0 W/m·K pad at 1.0mm thickness. Comparing conductivity values without accounting for thickness leads to incorrect conclusions about which product performs better for a given application gap.
Assuming higher conductivity always means lower junction temperature
This is only true if everything else stays the same — same thickness, same surface conditions, same assembly pressure, same contact area. In real assemblies, a higher-conductivity pad that is too stiff to make good contact with a rough heatsink surface will underperform a softer, lower-conductivity pad that conforms properly. Junction temperature is determined by the full thermal path, not one material property in isolation.
Confusing thermal conductivity with thermal impedance
These are related but different quantities. Thermal conductivity (W/m·K) is a material property independent of geometry. Thermal impedance (°C·cm²/W) is a system property that depends on thickness and contact conditions. Some datasheets list both; some list only one. Make sure you know which one you are working with before plugging numbers into a thermal model.
Accepting datasheet values without asking for test conditions
A datasheet number without a stated test method and pressure is an incomplete specification. Accepting it at face value and comparing it against a properly documented value from another supplier introduces an error into the comparison that no amount of spreadsheet work will fix. The five minutes it takes to ask the supplier for test conditions is worth it.
Conclusion
Thermal conductivity is the most visible number in a TIM datasheet, but it is not a complete basis for supplier comparison or material selection. Test method, measurement pressure, pad thickness, surface conditions, and assembly clamping all interact to determine real interface performance — and none of these appear in the W/m·K value alone.
The comparison process that produces reliable results is straightforward: confirm the same test method across all candidates, normalize to thermal resistance at your working bond line thickness, request batch data rather than relying solely on datasheet values, and validate with samples in your actual hardware before making a production decision.
For procurement teams managing multiple suppliers or qualifying new materials, building this process into standard practice eliminates most of the surprises that come from datasheet-only comparisons.
If you need support evaluating thermal conductivity data for a specific application, or want to request characterized samples for testing, contact us with your assembly details.