Welcome to Taxo Tape
Testing Methods for Thermal Conductivity: ASTM vs. ISO Standards Explained
Introduction: Why Thermal Conductivity Testing Matters
For any thermal interface material (TIM), the thermal conductivity number is one of the first things engineers look at. It drives thermal simulations, heat-spreader design, and even basic go / no-go decisions when shortlisting suppliers. A few watts per meter-kelvin on a datasheet can mean the difference between a safe junction temperature and a field failure.
But that number never exists in a vacuum. It is always tied to a test method, a test temperature, and a specific way of mounting the sample. That is why different standards exist. ASTM and ISO each define how the material is prepared, how the heat flow is applied, and how the result is calculated. If two suppliers use different methods, their “5.0 W/m·K” values may not be directly comparable.
Understanding the main ASTM and ISO standards behind thermal conductivity data helps OEMs and design engineers read datasheets more critically and ask the right questions early in a project.
Key Concepts in Thermal Conductivity Testing
Before looking at specific standards, it helps to align on a few basic ideas.
Through-plane vs. in-plane thermal conductivity
For many TIMs—gap fillers, pads, greases—the critical direction of heat flow is through the thickness of the material, from one surface to the other. This is called through-plane thermal conductivity.
Some materials, such as graphite sheets or highly oriented films, conduct heat much better along the plane than through the thickness. In these cases, both in-plane and through-plane values may be relevant, depending on the design. Knowing which direction was measured is essential when you compare materials or build a thermal model.
Steady-state vs. transient test methods
Thermal conductivity can be measured under steady-state or transient conditions:
Steady-state methods wait until temperatures and heat flow are stable, then calculate thermal conductivity from the temperature gradient and heat flux. These tests often take longer but are intuitive and widely used for TIMs.
Transient methods apply a short heat pulse or power step, then analyze the time-dependent temperature response. They can be faster, work with smaller samples, and provide additional information, but the data analysis is more complex.
Bulk materials vs. thin TIMs
Many standards were originally written for bulk materials—solid plastics, metals, ceramics—with millimeter-level thickness and rigid shape. Thermal interface materials are often very different:
Soft gap pads that compress under pressure
Thin adhesive tapes and films
Flowable greases and gels
For these materials, surface preparation, clamping pressure, and sample thickness strongly influence the measured result. That is why some standards are more suitable for TIMs than others.
Overview of Common ASTM Thermal Conductivity Standards
3.1 ASTM D5470 – Thermal Resistance of TIMs (Metal / Metal Hot Plate)
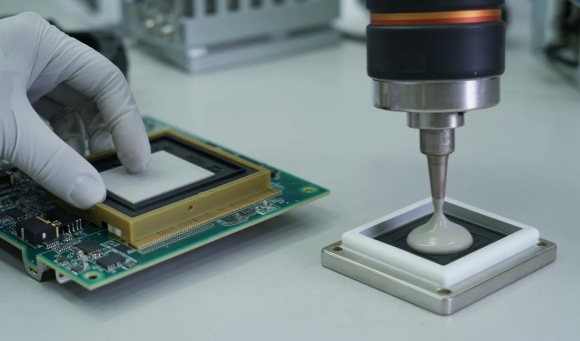
ASTM D5470 is one of the most widely cited standards for thermal interface materials. It uses a metal / metal hot plate setup, where the TIM is sandwiched between two metal blocks under a defined pressure.
A known heat flow passes through the stack.
Temperatures are measured at several positions in the metal blocks.
From the temperature gradient and heat flow, the thermal resistance of the interface is calculated.
D5470 is especially useful for gap pads, greases, and phase-change materials because it mimics real mounting conditions: two solid surfaces pressed together with a compressible or semi-liquid layer in between. From thermal resistance and sample thickness, an apparent thermal conductivity can be derived.
3.2 ASTM E1530 – Guarded Heat Flow Meter
ASTM E1530 describes a guarded heat flow meter method. The sample is clamped between a hot plate and a cold plate. A heat flux transducer and guard system help ensure one-dimensional heat flow.
This method is suitable for flat, relatively rigid samples with uniform thickness, such as certain pads, composites, or insulating boards. It can be used to report both thermal resistance and thermal conductivity. Compared with D5470, it is often more oriented to bulk products but is still applied to some TIM formats.
3.3 Other relevant ASTM methods for bulk solids
Besides D5470 and E1530, ASTM includes several methods for measuring thermal conductivity of bulk solids, such as:
Steady-state plate methods for insulating materials
Transient hot wire or hot disk techniques for solid plastics and ceramics
These methods are valuable when characterizing substrates, housings, or potting compounds, but they may not capture the full behavior of soft, thin, or highly compressible TIMs used in electronic assemblies.
Overview of Common ISO Thermal Conductivity Standards
4.1 ISO 22007 Series – Transient and steady-state methods for plastics
The ISO 22007 series defines various methods for determining thermal conductivity of plastics and polymeric materials. It covers both steady-state and transient approaches. Examples include:
Transient hot-wire methods
Guarded hot-plate methods
Laser flash techniques for thin sheets or films
These methods are frequently used when the base material of a TIM is a polymer, or when the same lab equipment is already set up for plastics testing.
4.2 Laser flash, hot wire, and other ISO approaches
Beyond ISO 22007, several ISO standards describe laser flash and hot wire techniques. In laser flash, one side of a thin sample is subjected to a short energy pulse, and the temperature rise on the opposite side is recorded. From this time response, thermal diffusivity and then thermal conductivity can be calculated.
Hot wire methods embed or place a heated wire in contact with the sample and analyze the temperature rise over time. These transient techniques are powerful for thin, homogeneous materials and can cover a wide temperature range.
4.3 Typical use cases for ISO methods
ISO methods are widely used for:
Polymers and filled plastics used as substrates or molding compounds
Thin films and tapes
Composite materials where the polymer matrix is dominant
In the context of thermal interface materials, ISO methods can be a good choice for films, tapes, and certain bulk plastics, especially when a lab is already accredited to ISO-based procedures.
ASTM vs. ISO: What’s the Difference in Practice?
On paper, ASTM and ISO both aim to provide reliable, repeatable data. In practice, several factors make their results different and sometimes hard to compare directly.
Test principle and equipment differences
ASTM D5470 uses a stacked metal / TIM / metal configuration with temperature sensors along the metal blocks. ISO 22007 methods may rely on transient hot wire or laser flash setups that do not resemble a real electronic interface. Guarded hot-plate or heat-flow-meter systems again have their own geometry.
Different heat-flow paths, sensor positions, and assumptions lead to different sensitivities to contact resistance, voids, and sample preparation.
Sample thickness, contact pressure, and interface conditions
For compressible gap pads and greases, contact pressure and final thickness are critical. ASTM D5470 explicitly considers clamping force and can be run at application-like pressures. Many ISO methods, especially for plastics, are designed around more rigid samples with fixed thickness.
If one supplier reports a value measured at high pressure (thin, well-conformed pad) and another at low pressure (thicker, less conformal), the higher conductivity number may simply reflect better contact, not a fundamentally better material.
Data output: W/m·K vs. thermal resistance
Some methods report primarily thermal conductivity (W/m·K), while others focus on thermal resistance (K·cm²/W or K/W). For TIM design, thermal resistance at a given thickness and pressure is often more directly useful, because that is what controls temperature rise across the interface.
When comparing materials, it is important to know:
Was the value calculated from thermal resistance, or measured directly as conductivity?
At what thickness and pressure was the test run?
Over what temperature range was the data taken?
Pros and cons for TIMs and electronic materials
ASTM methods (especially D5470)
Pros: Closer to real mounting conditions for TIMs; includes pressure control; directly measures interface performance.
Cons: Test can be slower; requires careful alignment and surface preparation; results may vary between labs if procedures are not harmonized.
ISO methods (plastics and transient techniques)
Pros: Well suited for base polymers, films, and composites; transient methods can be faster and need smaller samples; good for material development and comparison inside one lab.
Cons: Geometry may be less representative of an actual thermal interface stack; contact resistance effects can be different from real assemblies.
For OEMs and design engineers, the key takeaway is simple: do not look at the W/m·K number alone. Always check which standard was used, how the sample was prepared, and under what conditions the test was carried out. Aligning on a test method with your supplier early in the design process makes it much easier to compare options and avoid surprises later in validation.
How Test Conditions Influence Reported Thermal Conductivity
Thermal conductivity is not a fixed “magic number”. It depends strongly on how the material is mounted and tested. Small changes in test conditions can shift the reported value by tens of percent.
Pressure and compression for thermal pads
For soft thermal pads and gap fillers, pressure is one of the most critical parameters. Higher pressure usually means:
More compression
Better surface contact
Lower void content
All of this reduces the measured thermal resistance and can lead to a higher calculated thermal conductivity. A pad that shows “6.0 W/m·K” at 200 kPa may look like “4.0 W/m·K” at 50 kPa simply because it is less compressed and not conforming as well.
When you read a datasheet, always look for the test pressure and final thickness. These two numbers are essential if you want to compare one TIM to another.
Temperature range and stability
Thermal conductivity is also temperature dependent. Many TIMs are polymer-based and show different behavior at 25°C, 80°C, or 120°C. A value quoted at room temperature is not always representative of real operation, especially in power electronics, EV batteries, or telecom base stations.
In addition, some test methods assume that the system has reached steady-state. If the temperature is still drifting when the measurement is taken, the calculated thermal conductivity can be misleading.
Surface roughness, flatness, and interface materials
The surfaces on both sides of the TIM matter. Rough, warped, or contaminated plates can introduce extra contact resistance that is not purely related to the bulk material.
To stabilize results, some labs use:
Standardized metal plates with defined roughness and flatness
Release films, foils, or thin interface layers
These choices affect how the material wets or conforms to the surfaces. If two labs use different plate finishes or interface layers, they can get different numbers from the same material.
Repeatability and lab-to-lab variation
Even with the same standard, lab-to-lab variation is real. Small differences in:
Equipment design and calibration
Sample preparation and handling
Operator experience
can produce noticeably different results. This is why many companies rely on relative comparison within the same lab rather than mixing data from multiple sources without checking.
Choosing the Right Standard for Your Application
There is no single “best” method for all materials. The right choice depends on the type of TIM and how it will be used in the end product.
7.1 Gap fillers, pads, and greases in power electronics
For compressible gap pads, silicone gels, and greases mounted between two solid surfaces, methods that mimic real interface conditions are preferred.
ASTM D5470 is often a good starting point because it:
Uses metal / TIM / metal stacks
Allows control of pressure and thickness
Reports interface thermal resistance
This combination makes it easier to translate lab data into a real power module, IGBT, or rectifier assembly.
7.2 Thin films, tapes, and graphite sheets
For thin adhesive tapes, films, and graphite sheets, the situation can be different:
Through-plane performance matters for heat going across the interface.
In-plane conductivity can be critical for spreading heat along the plane, especially for graphite.
Here, you may see a mix of D5470-style measurements and ISO methods (including transient techniques) that focus on thin films. When comparing suppliers, check carefully:
Which direction (in-plane / through-plane) is reported
Which standard and equipment were used
Whether the test configuration resembles your actual stack-up
7.3 Battery packs, inverters, LED modules, and base stations
For complex systems such as battery packs, inverters, LED drivers, and 5G base stations, you often use more than one type of TIM in the same design. A practical approach is:
Use D5470-type data for gap pads and gels between cells, cooling plates, and housings.
Use ISO or transient-method data for thin insulating films or adhesives.
Validate the full stack with application-level thermal testing (modules, packs, or assembled luminaires).
When to request ASTM, when ISO is acceptable
As a simple rule of thumb:
If you are evaluating gap fillers, pads, or greases for electronic assemblies, it is reasonable to request ASTM-based data, especially D5470.
If you are evaluating films, tapes, or polymer composites, ISO methods can be perfectly acceptable, as long as the test configuration is clearly described.
The most important point is transparency. You should know which standard was used and how the material was mounted.
Why cross-comparing data from different methods can be risky
Comparing “5.0 W/m·K” from one supplier (ASTM D5470, high pressure, thin sample) with “3.5 W/m·K” from another (ISO method, lower pressure, different geometry) can easily lead to wrong conclusions.
In practice, it is safer to:
Compare materials tested under the same method and conditions
Run your own benchmarking in a single lab
Use application-level test results to confirm critical choices
How to Read and Compare Supplier Thermal Conductivity Data
Key questions to ask on datasheets
When you review a TIM datasheet, look beyond the bold W/m·K number and ask:
Which test method / standard was used? (ASTM D5470, ASTM E1530, ISO 22007, etc.)
What was the sample thickness and final compressed thickness?
What pressure or clamping force was applied?
At what temperature (or temperature range) was the test performed?
Is the reported value thermal conductivity, thermal resistance, or both?
If any of these key parameters are missing, it becomes hard to compare materials fairly.
Typical “marketing number” traps
Some common pitfalls include:
Reporting the highest value measured under very favorable lab conditions, without disclosing pressure or thickness.
Mixing different test methods in the same table without clear labels.
Using a large conductivity number in headers and graphics, but quoting more conservative numbers only in the fine print.
Being aware of these “marketing number” tricks helps you ask better questions and avoid over-optimistic simulations.
Focusing on thermal resistance under real mounting conditions
For design work, thermal resistance under realistic mounting conditions is often more meaningful than an isolated conductivity value.
If possible, ask suppliers for:
Thermal resistance vs. pressure curves
Data measured at your target thickness
Information on how the pad or grease behaves over time and temperature
This makes it easier to evaluate how the TIM will perform inside your battery module, inverter, or LED luminaire, not just in a lab fixture.
Case Example: Same Material, Different Test Method, Different Result
To illustrate the impact of test conditions, consider a simplified example of the same gap pad tested in two different configurations.
Case A – ASTM D5470-style test
From this, the apparent thermal conductivity is:
Pad between two metal plates
Compressed from 1.0 mm nominal to 0.8 mm
Test pressure: 150 kPa
Measured thermal resistance: 0.4 K·cm²/W
Case B – ISO-based thin-sample setup
The apparent thermal conductivity now looks like:
Same material, but mounted with lower pressure
Final thickness: 1.0 mm (less compression)
Measured thermal resistance: 0.7 K·cm²/W
If you only saw the final numbers, you might think these are two completely different materials. In reality, the test pressure, thickness, and fixture changed, not the chemistry.
What this means for your safety margin in design
If your design assumes 2.0 W/m·K and you actually get behavior closer to 1.4 W/m·K in the final assembly, junction temperatures may run several degrees higher than expected. That can erode your safety margin and push you closer to reliability limits.
This is why it is important to:
Understand how the lab data was generated
Apply reasonable derating in simulations
Confirm critical designs with physical testing
Conclusion: Best Practices for OEMs and Design Engineers
When you evaluate thermal interface materials, the test method is just as important as the number printed on the datasheet. A few practical guidelines can help:
Look at the full test description, not only W/m·K. Always consider the standard used, sample thickness, pressure, and temperature.
Align on a test standard early. Agree with your suppliers whether ASTM D5470, E1530, or an ISO method will be used for comparison, and keep conditions as consistent as possible.
Use thermal resistance under realistic conditions. Focus on interface thermal resistance at your target thickness and pressure, not just on bulk conductivity.
Avoid mixing incompatible data. Be cautious when comparing numbers from different methods, labs, or equipment. When in doubt, run in-house benchmarking.
Validate with application-level tests. For key programs—battery packs, inverters, base stations, LED systems—confirm performance at module or system level, not only on material coupons.
With this approach, thermal conductivity numbers become a useful engineering tool, not a source of confusion. You can select TIMs with more confidence, build more robust thermal models, and protect your safety margins in real-world operation.