Welcome to Taxo Tape
How to Read a Thermal Material Datasheet: Key Parameters Engineers Should Check
Introduction: Why Datasheets Can Be Misleading
Most engineers start with the datasheet. It is quick, easy to share, and looks objective. But thermal material datasheets can be misleading if you only look at the bold numbers in the first line.
The biggest trap is focusing on a single thermal conductivity value in W/m·K and treating it as an absolute truth. In reality, that number depends on test method, pressure, thickness, temperature, and even the test lab. Two materials both listed as “5.0 W/m·K” can behave very differently in a real module.
To choose the right thermal interface material (TIM), you need to read the datasheet with a bit more care: understand what was actually measured, under which conditions, and which parameters matter for your design.
Thermal Conductivity vs. Thermal Resistance
2.1 What W/m·K Really Tells You
Thermal conductivity (W/m·K) describes how efficiently heat can move through a material. Higher W/m·K generally means better heat conduction potential.
However, the conductivity value on a TIM datasheet is often an apparent value calculated from a specific test stack. It is not a pure material constant like the conductivity of copper. Fillers, porosity, and contact resistance all play a role.
2.2 Thermal Resistance (R_th) and Interface Performance
For real assemblies, thermal resistance is often more useful. Thermal resistance (R_th) describes the total temperature drop across the material at a given heat flow. It depends on:
Material conductivity
Actual thickness in the application
Contact quality on both sides
This is what determines junction-to-case or case-to-heat-sink temperature rise. A material with “only” 3 W/m·K but very good conformability can show lower interface resistance than a stiffer 5 W/m·K pad that cannot fully wet the surfaces.
2.3 When to Focus on W/m·K, When to Focus on R_th
Use W/m·K when you compare basic material families or want a quick first filter.
Use R_th at a defined thickness and pressure when you design the actual stack and simulate temperatures.
If you have to choose one number to trust for a TIM in a real product, pick thermal resistance under realistic mounting conditions, not just the headline W/m·K.
Test Method and Standard
3.1 Common Methods (ASTM D5470, ASTM E1530, ISO 22007, etc.)
Thermal data on a datasheet is always linked to a test method. For TIMs and related materials you will often see:
ASTM D5470 – Metal / TIM / metal stack, widely used for gap pads, greases, and gels.
ASTM E1530 – Guarded heat flow meter for flat samples.
ISO 22007 series – Methods for plastics and films, including transient and steady-state techniques.
Sometimes the method is stated clearly; sometimes it is hidden in small print or missing completely.
3.2 Why Different Methods Give Different Numbers
Different methods use different:
Fixture geometries and sensor positions
Pressures and clamping systems
Temperature ranges and measurement times
As a result, the same material can show different apparent conductivity depending on the method. Comparing a D5470 result with a value from a transient ISO method is rarely apples-to-apples.
3.3 Questions to Ask Suppliers About Test Methods
When a key design depends on a TIM, it is reasonable to ask suppliers:
Which standard and version did you use?
What was the sample thickness and test pressure?
What temperature was used for the reported value?
Was the value measured directly, or calculated from thermal resistance?
Suppliers who can answer these questions clearly are usually easier to work with in later design and validation stages.
Thickness, Compression, and Pressure
4.1 Nominal vs. Compressed Thickness for Gap Pads
Many gap pads have a nominal thickness on the datasheet, but under clamping they compress. A “1.0 mm” pad might run at 0.7–0.8 mm in the real assembly.
If the datasheet lists thermal resistance at a compressed thickness but you design around nominal thickness, you can underestimate temperature rise. Always check:
Nominal thickness
Thickness at the test pressure
Recommended operating compression range
4.2 Test Pressure and Its Impact on Measured Performance
Higher pressure usually improves contact and lowers interface resistance, especially for soft materials. That is why test pressure matters:
At low pressure: more voids, higher resistance
At higher pressure: better conformability, lower resistance
When you see “5.0 W/m·K” on a pad datasheet, ask: At what pressure? If your assembly cannot reach that pressure (for example, because of mechanical limits on a PCB or battery cell), you may not see the same performance.
4.3 Interpreting “X W/m·K @ Y kPa” on a Datasheet
Some datasheets already combine conductivity and pressure, for example:
3.0 W/m·K @ 100 kPa, thickness 1.0 mm
Treat this as a package deal: the number only makes sense together with the pressure and thickness. When comparing materials, try to normalize to similar conditions or ask for data at the pressure range you actually use.
Temperature Conditions
5.1 Test Temperature vs. Real Operating Temperature
Thermal tests are often done at room temperature, but many applications run much hotter:
Power modules at 80–125°C
LED boards in enclosed luminaires
Battery packs with hot spots during fast charge
If your system runs at higher temperature, ask for data measured closer to your operating point, or at least see how the material behaves over temperature.
5.2 Thermal Conductivity Over Temperature (Curves vs. Single Points)
Good datasheets provide a curve of thermal conductivity or resistance vs. temperature. This is more useful than a single point, because you can:
See whether performance improves or degrades with temperature
Build more realistic models for worst-case conditions
If only one point is given, use it with caution and consider adding a safety margin in your simulations.
5.3 Behavior at High Temperature and Thermal Aging
Long-term exposure to heat, cycling, and humidity can change the material:
Soft pads can harden or crack.
Greases and gels can bleed or pump out.
Adhesives can lose bond strength.
If a design is safety-critical or hard to service, look for aging or reliability data on the datasheet (e.g., after 1000 h at elevated temperature, or after thermal cycling) or ask the supplier to share internal results.
Mechanical Properties That Affect Thermal Contact
6.1 Hardness / Shore vs. Conformability
Mechanical hardness (e.g., Shore 00 or Shore A) tells you how soft or stiff a material is. For a thermal interface, softness is often an advantage because it:
Fills micro-gaps and surface roughness
Reduces voids and air pockets
Lowers contact resistance
A very high W/m·K material that is too hard may perform worse in practice than a softer material with slightly lower conductivity.
6.2 Compression Set, Recovery, and Pump-Out Risk
Over time, mechanical behavior influences thermal stability:
Compression set and recovery show how well a pad maintains thickness and contact after being compressed.
Pump-out (for greases and gels) describes how material moves away from the hot spot under thermal cycling and vibration.
Datasheets that include these properties help you judge whether the material will hold its performance over the life of the product.
6.3 Handling, Rework, and Assembly Considerations
The best material on paper is useless if it is very hard to assemble. Practical points include:
Does the pad tear easily during placement or rework?
Is there a carrier film or fiberglass reinforcement to help handling?
Is the grease too messy for your production line?
These aspects are sometimes summarized as “handling” or “processability” in the datasheet, or described in application notes. For high-volume production, they are just as important as one extra W/m·K on the spec line.
Electrical and Safety Parameters
For many designs, thermal performance is only half of the story. The same material often has to provide electrical insulation and meet safety requirements.
7.1 Dielectric Strength and Breakdown Voltage
If the TIM sits between live parts and a grounded heat sink, dielectric strength is critical. On the datasheet, you may see:
Dielectric strength (kV/mm)
Breakdown voltage (kV) at a given thickness
Always relate breakdown voltage to the actual thickness in your design, not just the nominal value on the datasheet. Check that the insulation margin matches your system voltage and internal safety rules.
7.2 Volume Resistivity and CTI (if relevant)
Some datasheets include:
Volume resistivity (Ω·cm), showing how well the material resists current flow through its bulk.
CTI (Comparative Tracking Index), relevant when surfaces can be polluted or exposed to moisture and voltage.
For low-voltage LED or battery applications, these values may be less critical. For higher-voltage power electronics, they are part of the overall insulation concept.
7.3 Flammability Ratings (e.g., UL 94) for System Approval
Flammability ratings such as UL 94 V-0 or V-1 are often required to pass system-level approvals. When a TIM sits inside a certified device, its flammability rating can become a key constraint.
Check that:
The rating exists and is clearly stated
The thickness and color tested are close to your intended version
If a project is safety-critical or needs formal certification, involve your compliance team early when selecting materials.
Reliability and Long-Term Stability
Short-term lab data is useful, but many failures in the field are long-term issues: dry-out, pump-out, cracking, or loss of insulation.
8.1 Thermal Cycling, Humidity, and Vibration Data
Look for reliability tests such as:
Thermal cycling (e.g., -40 to 125°C for hundreds or thousands of cycles)
High-temperature / high-humidity storage (e.g., 85°C/85% RH)
Vibration or shock tests if the application is mobile or automotive
Even a simple note like “no visible cracks, stable thermal resistance” after testing is better than no information at all.
8.2 Change of Thermal Performance After Aging
Good datasheets show not only initial values, but also how thermal resistance or conductivity changes after aging. For example:
R_th before and after 1000 h at elevated temperature
Change in compression set after cycling
This helps you judge how much safety margin you need to keep performance within spec over lifetime.
8.3 Outgassing, Bleed, and Material Compatibility
In sealed systems, outgassing and bleed can be important:
Silicone oil bleed can contaminate optics or connectors.
Outgassing may fog lenses or affect sensitive sensors.
Chemical compatibility with plastics, adhesives, or coatings can be a concern.
If your design includes optics, sensors, or delicate coatings, ask for information on outgassing and material compatibility, even if it is not on the standard datasheet.
Typical Marketing Traps on Thermal Datasheets
9.1 “Up to” Numbers and Best-Case Conditions
Be cautious with phrases like:
“Up to 7 W/m·K”
“Thermal resistance as low as…”
These often refer to best-case conditions (very high pressure, minimal thickness, perfect surfaces). Check if there are more realistic numbers deeper in the document or in application notes.
9.2 Mixing Different Test Methods in One Table
Some datasheets list several products in one table but use different test methods for different lines. Without a clear note, this can make the “best” product look much better simply because it was tested differently.
Always check whether:
All values in a table use the same method and conditions
Any footnotes mention exceptions or special setups
9.3 Missing Details: Pressure, Method, Temperature Not Stated
If a datasheet shows a bold W/m·K value but does not state:
The test method
The pressure and thickness
The test temperature
then the number is difficult to trust for serious design work. Treat such data as a rough indication only and ask for more details before committing.
How to Compare Two Thermal Materials Fairly
10.1 Normalizing Data to the Same Thickness and Conditions
When you compare two TIMs, try to bring them to a common basis:
Same thickness (or as close as possible)
Similar or stated pressure range
Same test temperature or at least the same type of test
If needed, calculate or estimate thermal resistance at the thickness you will actually use.
10.2 Using Application-Level Test Setups (Modules / Mock-Ups)
For critical projects, lab coupons are not enough. Small application-level tests can be very revealing, for example:
A test fixture that mimics your battery module or inverter interface
An LED board with multiple materials tested side-by-side
This kind of test combines thermal, mechanical, and process effects in a way that a standard lab method cannot fully capture.
10.3 When to Ask for Custom Testing or Additional Data
Ask for extra data when:
The project is high value or safety-critical
Operating conditions are far from standard tests (very high temp, unusual pressure, special environment)
Datasheet information is incomplete or inconsistent
Serious suppliers usually have internal test data they can share, or they can run additional tests under agreed conditions.
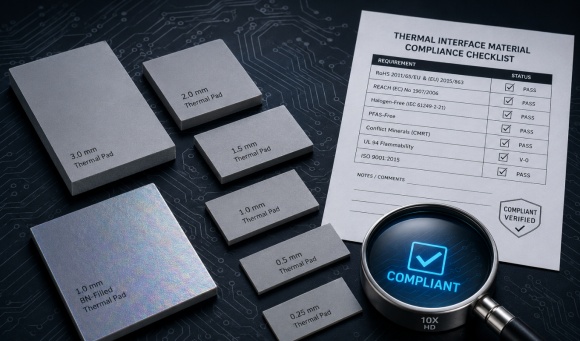
Checklist: Key Items an Engineer Should Always Confirm
When you review a thermal material datasheet, it helps to have a short checklist. For each candidate material, try to confirm at least:
Test method / standard used (e.g., ASTM D5470, ISO 22007).
Thermal conductivity and/or thermal resistance and how they were derived.
Sample thickness and compressed thickness (for pads and gap fillers).
Test pressure or clamping force applied during measurement.
Test temperature (and, if available, performance over temperature).
Key mechanical data (hardness, compression range, compression set).
Electrical properties if needed (dielectric strength, breakdown voltage, resistivity).
Flammability rating and any relevant approvals (e.g., UL 94).
Reliability / aging information, especially for long-life products.
Any special notes on handling, bleed, outgassing, or compatibility.
Conclusion: Turning Datasheet Numbers into Reliable Designs
Thermal material datasheets are a useful starting point, but they are not the whole story. Headline W/m·K values, without context, can easily lead to over-optimistic simulations and tight margins in real hardware.
By looking at test methods, thickness, pressure, temperature, mechanical and electrical properties, you can turn raw datasheet numbers into realistic design inputs. Comparing materials under consistent conditions and verifying critical interfaces at module level will reduce surprises late in the project.
Close, technical communication with your suppliers is part of the process. When you treat the datasheet as the beginning of a conversation—not the final truth—you are far more likely to choose a TIM that performs as expected in the lab, on the line, and in the field.