Welcome to Taxo Tape
How Thermal Conductivity Test Methods Impact Reported W/m·K Values
Introduction: Why the Same Material Can Show Different W/m·K Values
Thermal conductivity, typically expressed in W/m·K, is one of the most frequently referenced parameters when selecting thermal interface materials (TIMs). For engineers working on LED lighting, power electronics, battery modules, or PCBA assemblies, this value is often used as a first filter when comparing materials.
However, a common question repeatedly comes up during material evaluation:
Why does the same thermal interface material appear with different thermal conductivity values in different datasheets?
In many cases, the material formulation has not changed at all. The difference lies in how the thermal conductivity was measured. Different test methods, standards, and test conditions can produce noticeably different W/m·K values for the same material.
This article explains how and why thermal conductivity test methods influence reported results, and what engineers should understand when interpreting datasheet values.
Understanding Thermal Conductivity in Real Applications
Before comparing test results, it is important to distinguish between two related but different concepts:
Intrinsic thermal conductivity of a material, which reflects the material’s internal ability to conduct heat
Measured or reported thermal conductivity, which is obtained under specific laboratory conditions
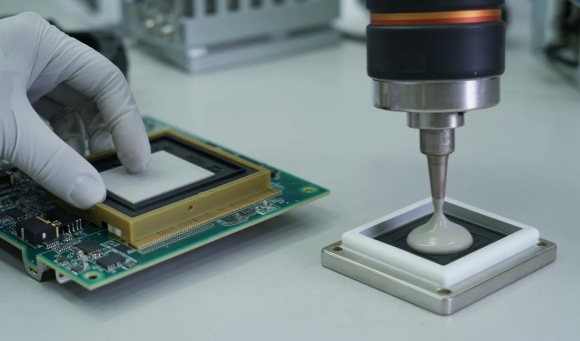
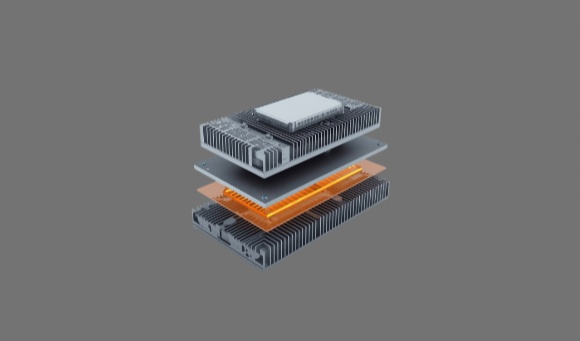
In real applications, heat does not flow through a material in isolation. Instead, it travels from a heat source to a heat sink, passing through interfaces, surface roughness, and contact gaps along the way. The path of heat flow, the direction of heat transfer, and the quality of contact surfaces all influence how effectively heat is dissipated.
As a result, laboratory measurements are best understood as comparative references, not absolute indicators of system-level thermal performance. A higher W/m·K value measured under ideal test conditions does not automatically translate into better heat dissipation in an actual device.
This is why material selection should always consider application-specific conditions, rather than relying solely on a single datasheet number.
Common Thermal Conductivity Test Methods Used in the Industry
Globally, several standardized test methods are used to evaluate thermal conductivity. Each method is based on a different measurement principle and is suitable for different material types.
3.1 ASTM D5470 – Steady-State Method
ASTM D5470 is one of the most widely used methods for testing thermal interface materials. In this steady-state method, heat flows through a material sample placed between two parallel plates under controlled pressure.
This method is commonly used for:
Thermal pads
Thermal gap fillers
Thermal greases and gels
Advantages:
Simulates real interface conditions more closely
Allows testing under controlled contact pressure
Limitations:
Results are sensitive to surface flatness
Applied pressure can significantly affect measured values
Because contact resistance is included in the measurement, ASTM D5470 often produces more conservative W/m·K values compared to other methods.
3.2 Laser Flash Analysis (LFA)
Laser Flash Analysis measures thermal diffusivity by applying a short heat pulse to one side of a sample and detecting the temperature response on the opposite side. Thermal conductivity is then calculated using material density and specific heat capacity.
LFA is commonly used for:
Solid materials
Graphite sheets
Ceramics and rigid composites
Advantages:
Fast measurement
High repeatability for solid samples
Limitations:
Not well suited for soft, compressible, or viscoelastic TIMs
Does not represent interface contact conditions
For this reason, LFA results often appear higher than values obtained from interface-based test methods.
3.3 Hot Disk / Transient Plane Source (TPS)
The Hot Disk or Transient Plane Source method uses a flat sensor that functions as both a heat source and a temperature detector. The sensor is placed between two pieces of the test material, and thermal conductivity is calculated based on transient heat flow.
This method is suitable for a wide range of materials, including:
Solids
Semi-soft materials
Some thermal pads
Pros:
Flexible sample requirements
Relatively fast testing
Cons:
Results depend on sensor placement and sample preparation
Less representative of real interface pressure conditions
Why Test Methods Produce Different W/m·K Results
Different test methods produce different thermal conductivity values because they emphasize different physical factors. Key influences include:
Contact resistance: Interface resistance plays a major role in steady-state methods but is largely excluded in diffusivity-based tests
Sample thickness: Thinner samples behave differently under heat flow and pressure
Applied pressure: Higher pressure improves contact quality and reduces thermal resistance
Test temperature: Thermal conductivity can vary significantly with temperature
Because of these variables, a higher reported W/m·K value does not always indicate better real-world thermal performance. In many cases, a material with a lower laboratory value may outperform a higher-rated material once installed in an actual system.
Understanding the test method behind the number is often more important than the number itself.
What Engineers and Buyers Should Look for in Datasheets
When reviewing thermal conductivity data, engineers and buyers should look beyond the W/m·K value itself and focus on how the data was generated. A few practical questions can quickly clarify whether two materials are truly comparable:
Which test standard was used?
For example, ASTM D5470, Laser Flash, or Hot Disk (TPS)Under what pressure and sample thickness was the test conducted?
These factors can significantly influence contact resistance and measured resultsWhat was the test temperature range?
Thermal conductivity often changes with temperature, especially for polymer-based TIMs
Comparing datasheet values only makes sense when the same test method and similar conditions are used. Mixing data from different standards can easily lead to incorrect conclusions.
It is also worth being cautious of datasheets that highlight unusually high W/m·K values without clearly stating the test method. In some cases, numbers are presented for marketing impact rather than for engineering accuracy.
How to Choose the Right Thermal Conductivity Data for Your Application
The most relevant thermal conductivity data depends on how and where the material will be used.
For TIMs between a heatsink and a power module, where interface contact and mounting pressure matter, steady-state methods such as ASTM D5470 tend to provide more meaningful insights.
For gap filling applications in LED luminaires or battery modules, where materials operate under defined compression and thickness, it is important to consider how the test setup reflects real assembly conditions.
Regardless of the application, final material selection should be supported by:
Sample testing under actual assembly conditions
System-level thermal performance evaluation, such as temperature rise or junction temperature reduction
Datasheet values are a starting point, but real validation happens at the application level.
Conclusion: Test Methods Matter More Than the Number Alone
Thermal conductivity values are not universal constants. They are method-dependent results influenced by test standards, sample preparation, and measurement conditions.
Understanding how thermal conductivity is measured allows engineers to interpret datasheet data correctly and make more informed material choices. In many cases, knowing the test method behind the number is more valuable than chasing the highest reported W/m·K value.
If clarification is needed, discussing test conditions and application requirements with the material supplier often leads to better alignment and more reliable results.
FAQ
Why does ASTM D5470 usually show lower W/m·K values?
Because this method includes interface contact resistance and reflects real mounting conditions, the measured values are often more conservative.
Is laser flash data reliable for thermal interface materials?
Laser flash analysis is reliable for solid and rigid materials, but it is generally less representative for soft or compressible TIMs used at interfaces.
Can I directly compare W/m·K values from different suppliers?
Only if the data is generated using the same test method under similar conditions. Otherwise, direct comparison can be misleading.