Welcome to Taxo Tape
TIM Application Failures in Power Electronics Production: Root Causes and Fixes
Introduction
A thermal interface material that performs well in a lab qualification test can still produce field failures at scale. The gap between controlled lab conditions and production-line reality is where most TIM reliability problems originate — not in material selection, but in how the material is applied, handled, and assembled across hundreds or thousands of units.
The symptoms are familiar to production engineers: thermal resistance measurements that are higher than design targets, unit-to-unit variation that exceeds acceptable limits, or field return rates that trace back to thermal interface degradation rather than component failure. In each case, the root cause is typically a process issue, not a material deficiency.
This article approaches TIM reliability from a manufacturing engineering perspective — focused on the production-line failure modes that cause consistent, repeatable problems, and the process controls that eliminate them. If you are looking for TIM selection guidance, that is covered separately. For the foundational application process — surface preparation, pad and grease application steps, and torque control — see How to Apply TIM Correctly: A Step-by-Step Process Guide. This article assumes the right material has already been specified and asks: why does it still fail in production?
Failure Mode Overview
Before diagnosing root causes, it helps to map the failure mode to the likely process stage where it originates.
| Failure Mode | Typical Symptom | Most Likely Process Stage |
|---|---|---|
| Thermal resistance higher than design target | Junction temperature above spec at initial test | Dispensing, surface prep, or mounting |
| Thermal resistance increases over time | Field returns increase after 6–18 months | Material degradation or mounting pressure loss |
| High unit-to-unit Rth variation | Wide spread in production thermal test data | Dispensing consistency or operator variability |
| Localized hot spots on thermal imaging | Uneven temperature map across component | Coverage gaps or pressure non-uniformity |
| High field return rate in specific production batches | Clustered failures by production date | Material storage, handling, or batch quality |
Each failure mode points to a different part of the process. Random variation across all units suggests dispensing or surface prep. Batch-clustered failures suggest material handling or incoming quality control. Time-dependent degradation points to mounting pressure or material stability issues.
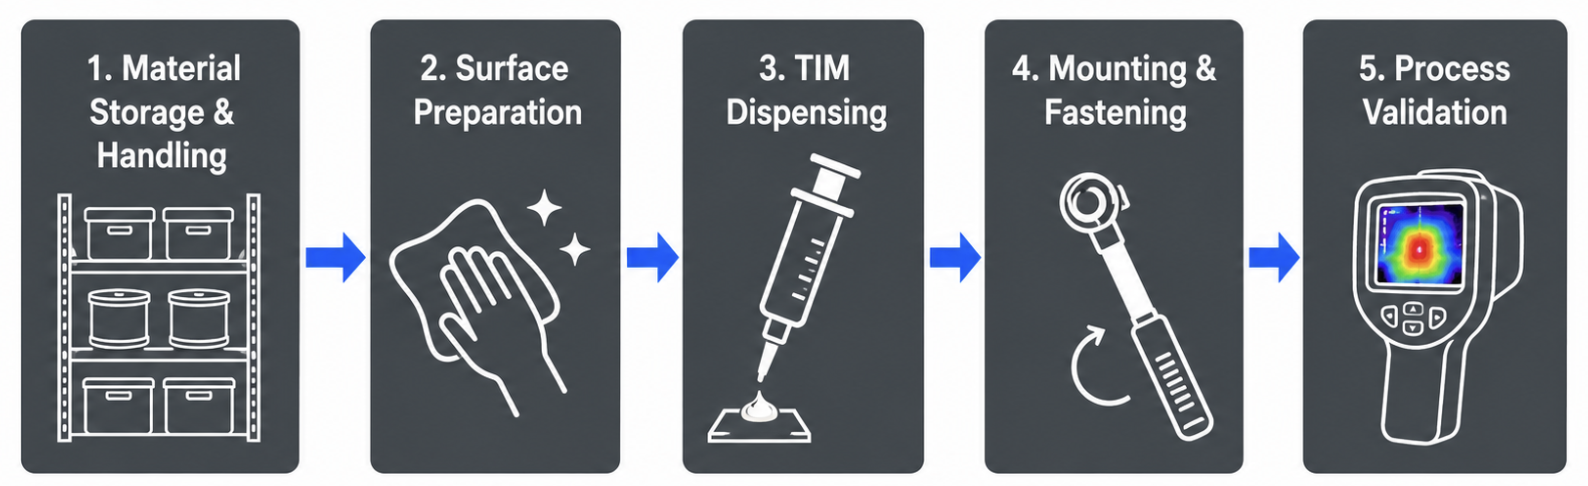
Root Cause #1: Dispensing Volume Inconsistency
The problem in production:
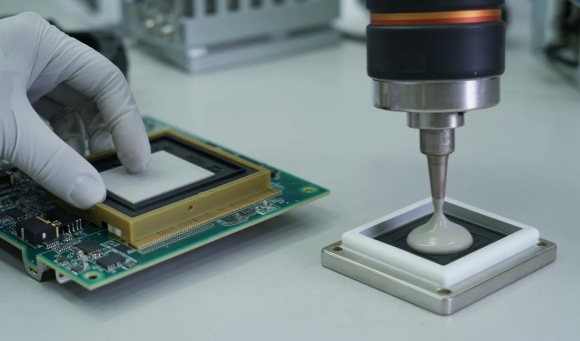
Manual grease or gel dispensing introduces volume variation that is difficult to quantify and easy to underestimate. A trained operator applying thermal grease with a syringe typically achieves ±20–30% volume variation between units — sometimes more under production time pressure. At a target BLT of 100 µm, a 30% volume increase produces a proportionally thicker bond line, adding measurable thermal resistance. Across a production run, this variation creates a spread in initial thermal resistance that no amount of material optimization can correct.
Automated dispensing equipment reduces this variation significantly — typically to ±5–10% under stable conditions — but introduces a different failure mode: parameter drift. Needle wear, pressure regulator drift, and temperature-dependent viscosity changes can all cause gradual shift in dispensed volume over time without triggering any alarm. A dispenser that was calibrated at the start of a shift may be applying 15% less material by the end of it.
Quantifying the problem:
The most direct way to measure dispensing consistency is to track BLT distribution across production units rather than relying on volume measurement alone. BLT can be measured destructively by cross-sectioning assembled units, or non-destructively using ultrasonic inspection or controlled squeeze-out measurement. A BLT distribution with standard deviation greater than 15–20% of the target value indicates a dispensing process that needs tightening.
Process controls that work:
Weight-based dispensing verification — weighing the applied TIM before assembly closure — catches volume drift without requiring destructive inspection. For automated lines, implement periodic calibration checks using a defined weight target and tolerance, not just visual inspection of the dispense pattern. For manual application, standardize the dispensing fixture, needle size, and application pressure rather than relying on operator judgment for volume control.
Root Cause #2: Surface Preparation Failures
Why surface condition matters more than most engineers expect:
A clean, flat metal surface and a surface with a thin layer of machining oil or finger contamination look nearly identical to the naked eye. Their thermal interface behavior is not identical. Hydrocarbon contamination from machining oils creates a thin barrier layer that prevents TIM from fully wetting the metal surface — effectively adding a high-resistance layer in series with the TIM. Studies on contact resistance between contaminated and cleaned aluminum surfaces show Rth increases of 0.05–0.2 °C·cm²/W from contamination alone, depending on contamination type and TIM viscosity.
Oxidation presents a different problem. Aluminum oxide forms rapidly on exposed aluminum surfaces and has significantly lower thermal conductivity than the base metal. For thermal grease and PCM applications where the TIM is expected to wet the surface directly, a thick oxide layer increases contact resistance at the metal-TIM boundary. For thermal pads, oxidation is less critical since the pad conforms mechanically rather than wetting chemically — but it still affects long-term interface stability under cycling.
Where surface prep failures occur in production:
The most common failure point is not skipping cleaning entirely — it is inconsistent cleaning. An operator who cleans some units but not others, or who uses a contaminated IPA wipe, introduces variation that looks like material variation when it is actually process variation. Heat sinks that sit on the production bench between cleaning and assembly accumulate contamination from the air and handling — even a 15-minute delay in a dusty environment can partially re-contaminate a cleaned surface.
Standardizing the process:
Define cleaning as a timed, documented step with a specific solvent, wipe type, and drying time — not a general instruction to "clean before assembly." IPA concentration matters: 99% IPA evaporates cleanly; 70% IPA leaves water residue that affects some TIM formulations. Implement a maximum time between cleaning and TIM application — typically 15–30 minutes in a standard production environment — and require re-cleaning if that window is exceeded.
For high-volume lines, consider inline cleaning immediately before the dispensing station rather than relying on pre-cleaned parts from a prior stage.
Root Cause #3: Mounting Pressure Variation
How pressure variation affects thermal resistance:
TIM thermal resistance is not fixed — it is pressure-dependent. Most thermal pads and gel formulations specify performance at a defined pressure, typically 50–200 kPa depending on material hardness. Below the minimum pressure, the material does not fully conform to surface irregularities, leaving residual air gaps that increase Rth. Above maximum pressure for soft materials, the material may extrude from the interface, reducing coverage and causing pump-out.
In a four-screw IGBT module assembly, the difference between applying screws in random order versus a defined cross-pattern can produce meaningful pressure distribution differences across the baseplate. Finite element analysis of typical power module geometries shows that random screw torque sequence can create ±25–40% pressure variation across the interface area — enough to produce measurable Rth differences between the high-pressure and low-pressure zones.
Multi-screw assembly sequence:
The correct tightening sequence for multi-fastener TIM assemblies follows the same principle as cylinder head gaskets — alternating cross-pattern, in stages, not sequential around the perimeter. A four-screw assembly should be tightened in two or three torque stages: first pass at 30–40% of final torque in cross-pattern, second pass at 70%, final pass at 100%. This distributes pressure progressively rather than creating a bending moment that lifts one side of the component while compressing the other.
Verifying pressure distribution:
Pressure-sensitive film — such as Fuji Prescale film — placed at the interface during a dry assembly run (without TIM) reveals the actual pressure distribution under your mounting hardware and torque specification. Any engineer who has run this test on a production assembly for the first time is usually surprised by how non-uniform the pressure map is compared to the assumed uniform distribution. This test costs very little and directly identifies whether your mounting hardware design needs modification before committing to a TIM specification.
Spring washers and compliance structures:
Standard flat washers transmit torque directly to clamping force with no compensation for tolerance variation. Spring washers or Belleville washers maintain a more consistent clamping force across the tolerance range of the fastener and mating parts — useful in assemblies where thermal cycling causes differential expansion that would otherwise relax the fastener preload over time. For applications with 10+ year service life targets, the small cost of compliance hardware is worth evaluating against the risk of pressure loss over the product lifetime.
Root Cause #4: Material Storage and Handling Failures
How storage conditions affect TIM performance:
Thermal greases and gels are formulated to specific viscosity and rheology profiles at defined storage temperatures. Most commercial TIM products specify storage between 5°C and 25°C, with shelf life of 6–12 months from manufacture date depending on formulation. Storage above the specified temperature range — even briefly — can accelerate oil separation in grease formulations and change the viscosity profile of gel products, affecting both dispensing behavior and final BLT.
In practice, storage failures in production environments usually come from two sources: materials stored in uncontrolled warehouse areas that exceed temperature limits during summer months, and materials used beyond their shelf life because inventory rotation is not enforced. Neither failure is obvious at the point of use — the material looks normal, dispenses normally, and may even pass initial thermal testing. Degradation often only becomes apparent through increased pump-out rates in thermal cycling testing or elevated field return rates in the first 12–18 months of product life.
Shelf life and open-container management:
Once a TIM container is opened, the clock on usable life accelerates. Exposure to air introduces moisture and particulate contamination, and the effective viscosity of open containers drifts more quickly than sealed ones. Standard practice in controlled production environments is to track open-container time separately from shelf life — typically limiting open container use to 30 days for grease and 7–14 days for two-component gel systems after first use.
For high-volume production, unit-dose packaging — pre-filled syringes or cartridges in single-use quantities — eliminates open-container degradation entirely and simplifies inventory management. The unit cost is higher but the process control benefit typically justifies it above a threshold production volume.
Incoming material verification:
Relying solely on supplier certificates of conformance is insufficient for critical thermal interface applications. Establish a receiving inspection protocol that includes viscosity verification against the material specification for each incoming lot — particularly for grease and gel formulations where viscosity directly affects dispensing behavior and BLT. A simple rotational viscometer measurement at incoming inspection catches batch-to-batch variation before it reaches the production line.
For thermal pad materials, incoming inspection should verify thickness and hardness against specification using calibrated instruments — not just visual inspection. Pad thickness variation of ±0.1 mm from nominal produces proportional BLT variation that may exceed your thermal resistance budget tolerance.
Process Validation Framework
What production validation actually requires:
Process qualification for TIM application is not a one-time event — it is a documented framework that defines when the process is in control, what triggers revalidation, and what evidence is required before production release. Most thermal interface failures that reach the field can be traced to production changes — new material lot, new dispensing equipment, new operator, modified torque specification — that were implemented without revalidation.
Pre-production validation steps:
Before releasing a TIM application process to production, the following should be documented and verified:
Target BLT at specified dispensing parameters, confirmed by cross-section measurement on a minimum of five assemblies. BLT distribution should fall within ±15% of target across all samples.
Pressure distribution map from pressure-sensitive film test at nominal torque and fastener sequence. Any zone showing less than 60% of nominal pressure should trigger mounting hardware redesign before production release.
Initial thermal resistance measurement on a minimum of ten production-representative assemblies, confirming Rth falls within design target plus tolerance.
Post-cycling thermal resistance measurement after a minimum of 100 thermal cycles at the application temperature range, confirming Rth change is within acceptable limits.
Thermal imaging as a production screening tool:
Infrared thermal imaging during electrical functional testing — where the assembly is powered and imaged under load — identifies coverage gaps, pressure non-uniformity, and material voids that do not show up in room-temperature inspection. Hot spots visible on thermal imaging that are absent in the design simulation indicate a TIM application problem, not a component problem. Implementing thermal imaging as a standard production screening step for high-reliability or high-cost assemblies catches process escapes before they reach the field.
Sampling frequency and control chart discipline:
Once the process is validated and in production, ongoing process control requires periodic BLT verification sampling — not just end-of-line thermal resistance testing, which catches problems after the fact. A control chart tracking BLT distribution across production batches, with defined upper and lower control limits, provides early warning of dispensing drift before it causes product failures. Sampling frequency depends on production volume and risk tolerance — a starting point of five units per shift for high-volume automated dispensing lines, with frequency reduction possible once the process demonstrates sustained stability.
Revalidation triggers:
Any of the following changes should trigger formal revalidation of the TIM application process before continued production:
Change of TIM material or supplier, even if the replacement is specified as equivalent. Viscosity, density, and rheology differences between nominally equivalent products affect BLT and dispensing behavior.
Change of dispensing equipment, needle size, or dispensing parameters beyond the validated range.
Change of mounting hardware, fastener specification, or torque value.
Surface finish change on heat sink or component baseplate — even a change of machining supplier for the same specified finish.
Any production interruption longer than the validated open-container use period for the TIM being used.
TaxoTape® Solutions
TaxoTape® specialize in thermal interface materials for power electronics production applications, including thermal pads, grease, gel, and phase change materials for IGBT modules, power supplies, UPS systems, and EV charging assemblies.
For production engineering teams, we provide application support beyond material datasheets — including BLT validation guidance, dispensing parameter recommendations for specific material grades, and incoming inspection criteria for pad thickness and hardness verification. Technical data sheets include viscosity specifications, shelf life and storage requirements, and open-container guidelines relevant to production process control.
Sample quantities are available for process validation before production commitment, with full documentation including batch certificates and material traceability.
Request samples or production application support →
Conclusion
TIM failures in power electronics production are rarely caused by the wrong material — they are caused by the wrong process. Dispensing volume drift, surface contamination, pressure non-uniformity, and material handling failures each produce characteristic failure signatures that point to specific process stages rather than material deficiencies.
Resolving these failures requires the same systematic approach as any other production process problem: define the failure mode, trace it to the process stage where it originates, implement a specific control, and verify the control is effective under production conditions rather than just in the lab.
The investment in process validation and ongoing statistical process control for TIM application is modest relative to the cost of field failures, warranty returns, and rework in high-reliability power electronics. Getting the process right once and maintaining it through documented controls is significantly less expensive than diagnosing and correcting field failures after the fact.
Contact TaxoTape® for production application support and material qualification assistance →
FAQ
Q: How do I know if my TIM thermal resistance problem is a material issue or a process issue?
The most reliable diagnostic is to compare thermal resistance measurements from controlled lab assemblies — built with careful surface preparation, verified dispensing volume, and calibrated torque — against production assemblies. If the lab assemblies meet your Rth target and production assemblies do not, the delta is process variation, not material performance. Start with dispensing volume verification and surface preparation consistency before assuming a material change is needed.
Q: What is an acceptable BLT variation range in production?
A reasonable target for controlled production processes is ±15% of the nominal BLT target. For a 100 µm BLT target, this means a 85–115 µm acceptable range. Beyond ±20%, the thermal resistance variation across units becomes large enough to create meaningful spread in junction temperature under load. If your current process produces BLT variation wider than ±20% of target, dispensing process improvement will have more impact on product reliability than any material upgrade.
Q: How often should dispensing equipment be recalibrated in production?
Calibration frequency depends on equipment type and production volume. For pneumatic dispensing systems, a weight-based verification check at the start of each shift — dispensing into a tared container and confirming weight against target — catches needle wear and pressure drift before it affects production. Full equipment calibration against traceable standards should be performed at intervals defined by the equipment manufacturer, typically every three to six months, or after any maintenance event.
Q: Can thermal imaging replace conventional thermal resistance measurement for production screening?
Thermal imaging and thermal resistance measurement provide complementary information rather than substituting for each other. Thermal imaging identifies spatial non-uniformity — coverage gaps, hot spots, pressure variation — that a single-point Rth measurement misses. Rth measurement provides a quantitative performance value that can be compared against design targets. For high-reliability production, both methods together provide more complete process control than either one alone. If resources allow only one method for production screening, thermal imaging under load catches more types of TIM application problems than room-temperature Rth measurement alone.